How to Extract a Table from an Image to Excel or CSV
By John Wang · Published 2026-08-23 · Updated 2026-08-23
Extract a table from a screenshot or photo, review OCR rows and columns, export clean CSV, and open the verified data safely in Excel.
Real-image case: recover five columns from a wide table screenshot
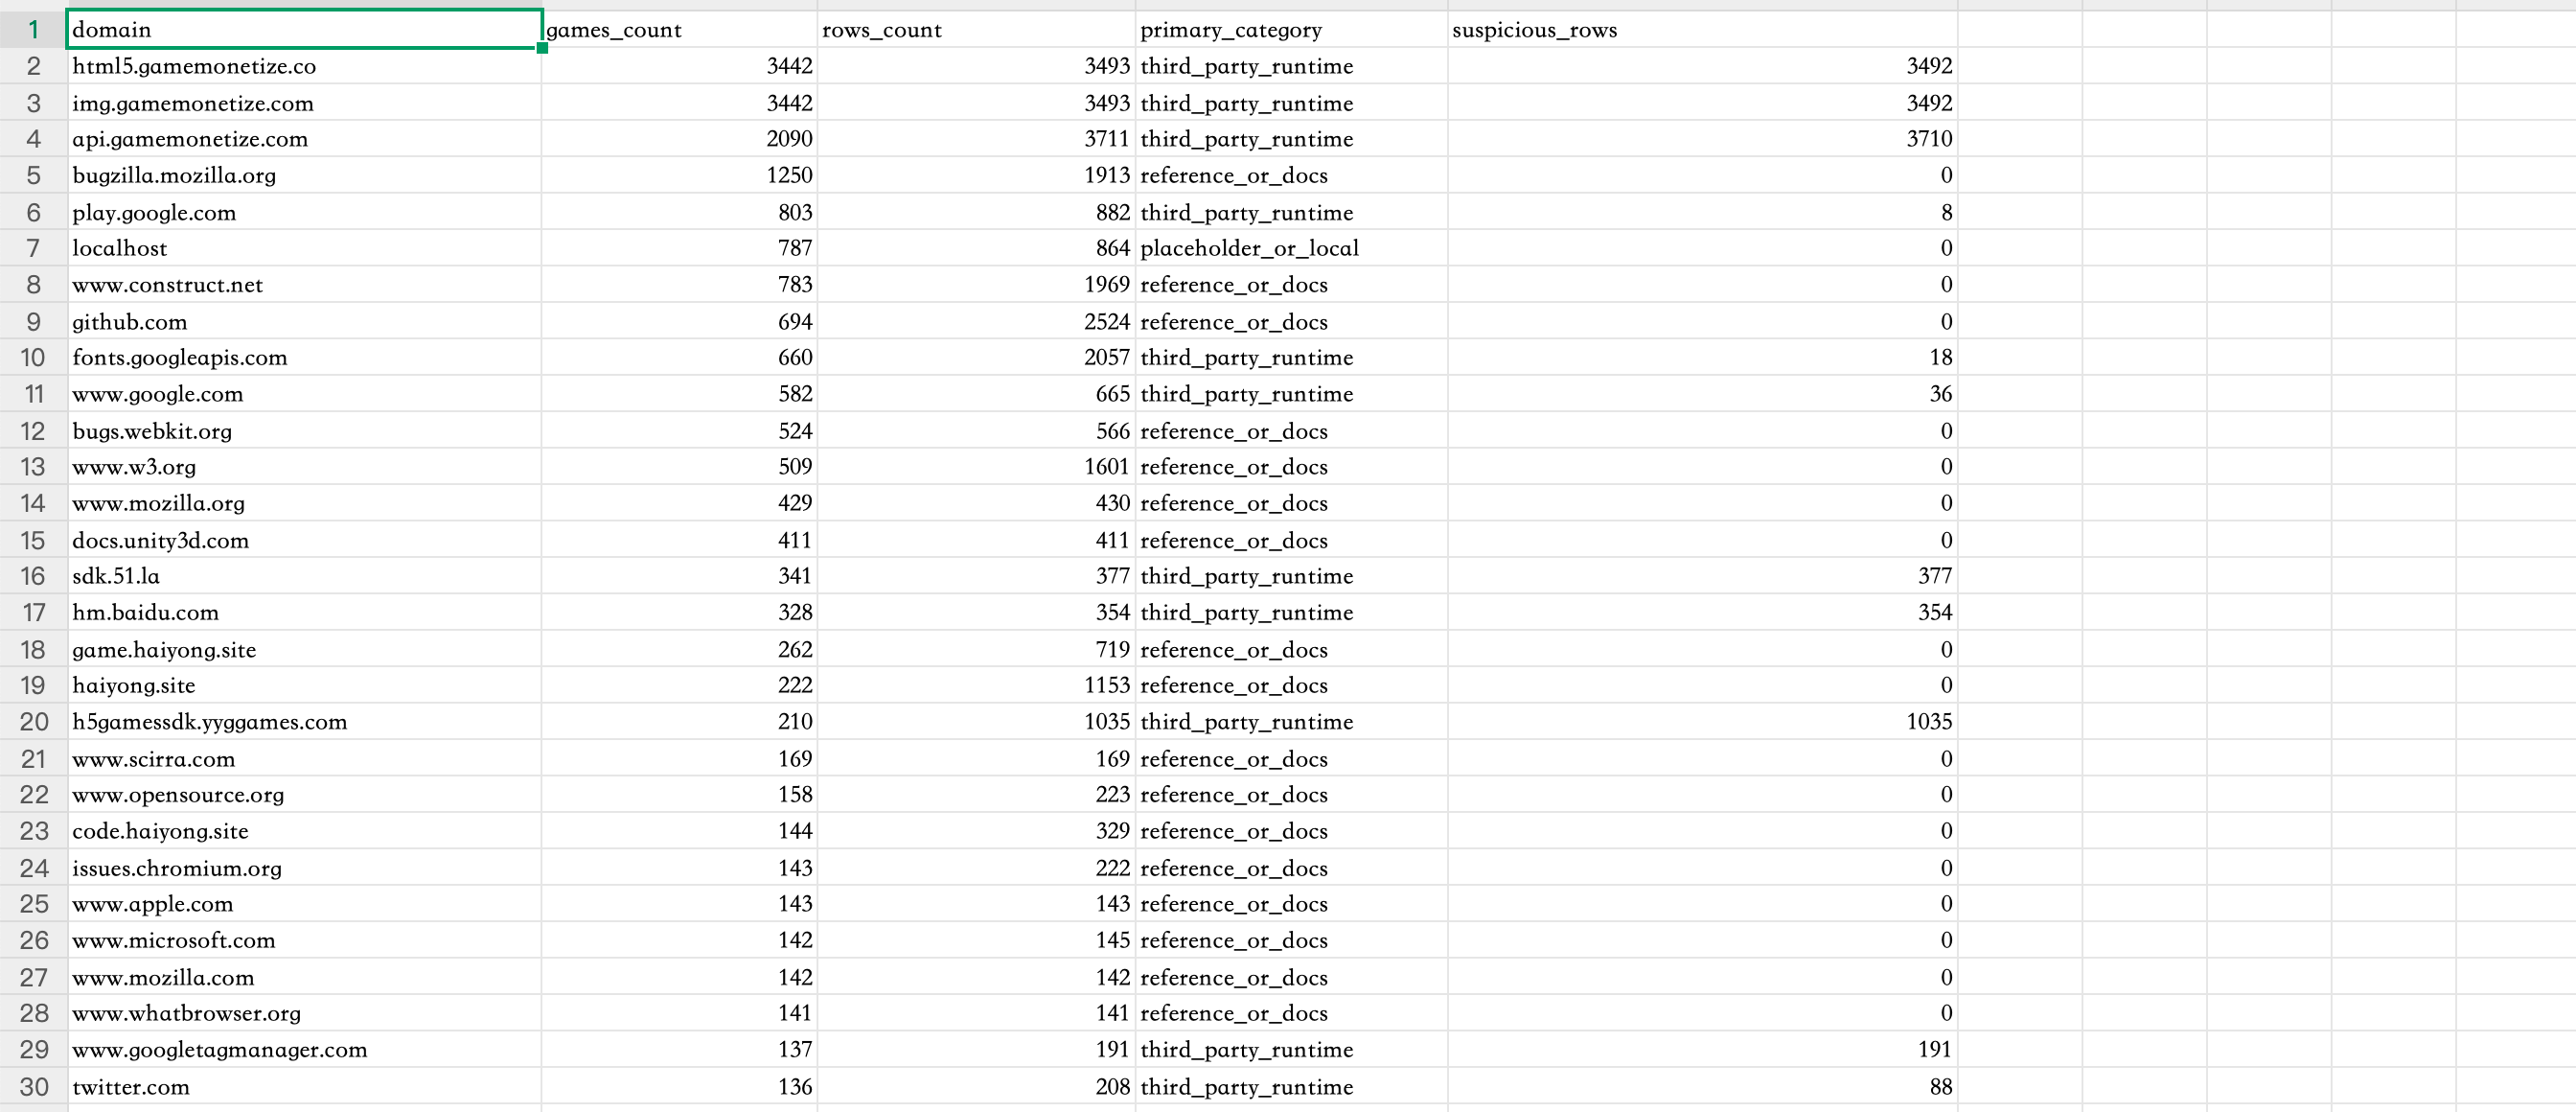
The downloadable case is a genuine PNG screenshot of spreadsheet-style data, not a drawn sample. It contains compact domain names, underscore-separated headers, categorical text, and right-aligned integers, making it useful for checking whether OCR preserved both characters and column boundaries.
- Source image dimensions: 2688 × 1160 pixels.
- Original file size: 280,365 bytes (about 274 KiB).
- Visible structure: one header row and 29 data rows.
- Populated columns: domain, games_count, rows_count, primary_category, and suspicious_rows.
1. Inspect the image before asking OCR to rebuild the table
An image contains pixels, not spreadsheet cells. OCR must first recognize characters and then infer which words and numbers belong to the same row or column. Open the source at 100% zoom and identify the real header row, the number of populated columns, repeated labels, blank cells, totals, footnotes, and any content outside the table. Record the expected structure before extraction so a tidy-looking result cannot silently redefine the data. Keep the untouched image beside the eventual CSV as the authority for every uncertain value.
The real case is 2688 × 1160 pixels and 280,365 bytes. It shows five populated columns and 29 visible data rows beneath the header. Its domains contain periods, its headers contain underscores, and its category values repeat similar strings. Those are useful acceptance checks: confirm that dots do not become commas, underscores do not disappear, numbers stay in the correct column, and repeated category names are spelled consistently. Do not infer missing values from neighboring rows; mark uncertainty and return to the pixels.
2. Prepare a clean, head-on source with readable characters
Crop browser chrome, empty margins, unrelated captions, and neighboring tables when they could be mistaken for data. For a camera photo, keep the sensor parallel to the page, correct perspective, avoid glare across cell values, and make sure all four table corners are visible. Prefer the original capture over a messaging-app copy that has already been heavily compressed. Enlarging a blurred or blocky image changes its pixel count but cannot reconstruct punctuation or digits that were never captured clearly.
Preserve enough resolution for the smallest characters and thin grid lines. PNG is a sensible working format for screenshots because its image compression is lossless, although extraction accuracy still depends on the captured pixels. Do not sharpen so aggressively that a 1 resembles a 7 or a period becomes a speck. If the table mixes languages, choose the correct language or auto-detection and plan extra review around abbreviations, proper names, codes, and characters shared by several scripts.
3. Run table extraction and choose CSV for spreadsheet work
Open Extract Tables, add the image, confirm Extract tables, and choose the document language. Select CSV when the result should become portable rows and columns for Excel, Google Sheets, a database import, or another analysis tool. Select structured JSON when an automated workflow needs table boundaries or source context that a flat file may not express. CSV is not an Excel workbook: it is a text-based interchange format that Excel can open or import, so formatting, formulas, charts, and multiple worksheets are not created from the screenshot.
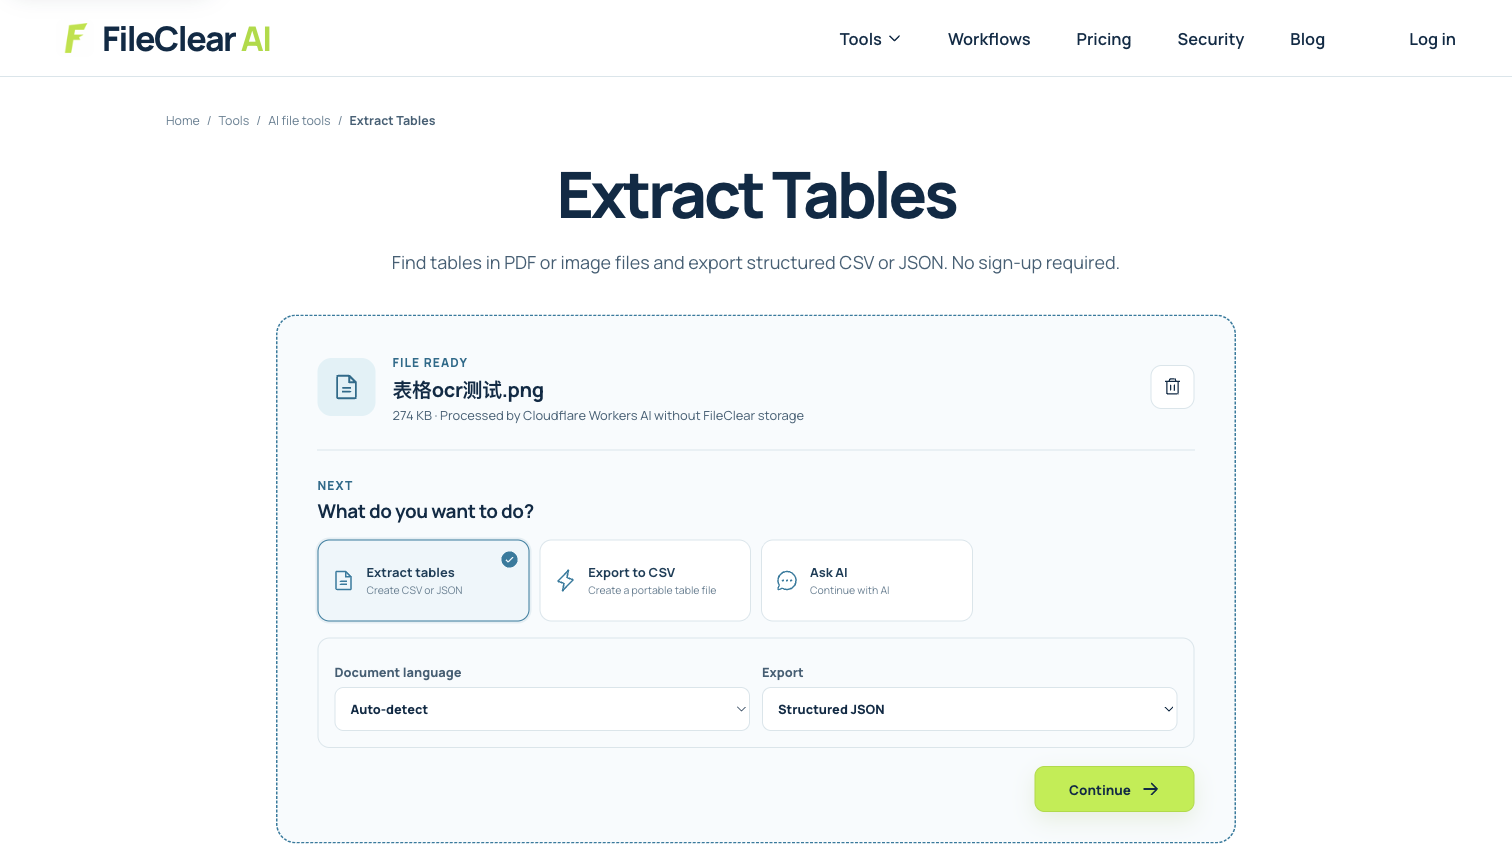
The settings screenshot shows the actual 274 KiB case image ready for processing. It does not claim a specific extracted result, row count, or output size. Start the job, then use the result inspector before downloading. If the service finds more than one table, identify the table that matches the recorded headers and exclude unrelated detections. When no useful structure is found, improve the crop, perspective, contrast, or source resolution instead of manually forcing a misaligned export into shape.
4. Review headers, boundaries, and high-risk values before download
Compare the preview with the source from left to right. Verify all five case-study headers, then check the first, middle, and final visible rows. Look for a value shifted into the neighboring column, two rows merged together, a repeated header treated as data, a blank cell filled from the row above, or punctuation changed inside a domain. Numeric columns deserve character-by-character checks around 0, 1, 5, 6, 8, decimal separators, minus signs, and thousands separators because one recognition error can change a later calculation materially.
Do not use a visually plausible total as the only validation. Recalculate counts or totals only after the row-level comparison, and keep identifiers as text when leading zeros or long digit strings matter. Treat values beginning with =, +, -, or @ cautiously before opening untrusted CSV content in spreadsheet software, because some applications can interpret them as formulas. The right-side preview is the approval gate: select the correct tables, fix the source and rerun when necessary, and download only after the displayed structure matches the image.
5. Import the verified CSV into Excel without changing its meaning
Open or import the approved CSV in Excel and confirm the delimiter, text encoding, decimal convention, and date interpretation before saving an XLSX copy. Assign text types to domains, account identifiers, postal codes, or any field whose leading zeros must survive. Check that long identifiers were not displayed in scientific notation and that dates were not swapped between month-first and day-first conventions. Preserve the original CSV as a simple exchange copy and make transformations in a separately named workbook.
Add formulas, filters, pivots, and charts only after the imported values pass review. Document any manual correction with the source row and reason, especially when the spreadsheet will support financial, compliance, scientific, or operational decisions. A dependable image-to-Excel workflow therefore has three artifacts: the original image, a reviewed CSV, and an analysis workbook derived from that CSV. The goal is not merely editable cells; it is traceable data whose headers, rows, values, and uncertainties can still be checked against the real picture.
Continue this file task
Related guides
Frequently asked questions
- Can I convert a screenshot of a table directly to Excel?
- You can extract the table to CSV, review the detected cells against the screenshot, and then open or import the CSV in Excel. The CSV contains values and columns, not the screenshot's formulas or workbook formatting.
- Why are OCR table columns shifted or merged?
- Faint grid lines, uneven spacing, perspective, merged cells, repeated headers, or a crop containing nearby content can confuse structure detection. Clean the source, rerun extraction, and verify every boundary before downloading.
- Is PNG or JPG better for extracting a table from an image?
- PNG is often preferable for crisp screenshots and line-based tables because its compression is lossless. A sharp, high-quality JPG can work for photos, but compression artifacts around small text and rules require closer review.
- How do I check an image-to-CSV result before using it?
- Compare every header plus the first, middle, and last rows, then inspect identifiers, punctuation, blank cells, negative values, decimal separators, and totals. Keep the source image available for traceability.
Sources and further reading
- Insert data from picture — Microsoft Support
- Detect and extract text from images — Google Cloud Vision Documentation
- RFC 4180: Common Format and MIME Type for CSV Files — RFC Editor